06June
Higher Asking Prices for Homes in Many San Francisco Bay Area Communities
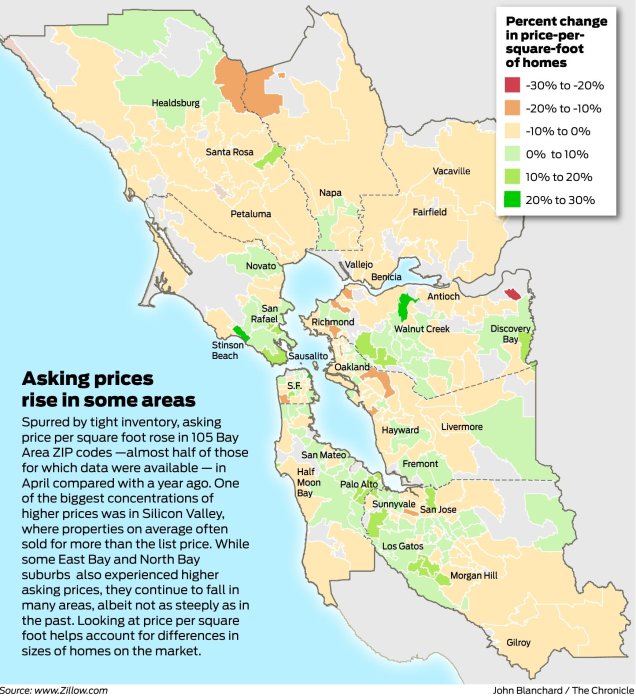
Over the last few weeks I have posted a lot about home sales market statistics for Sonoma County. The reason is not to be gratuitously geeky, but to provide some data, and some context for what appears to be a solidifying shift in the real estate market in Sonoma County and throughout the SF Bay Area. There is a lot I am planning to share on this subject but for now, I would just like to publish the graphic by John Blanchard and the San Francisco Chronicle from Sunday, June 3, 2012. It is based upon data from Zillow, the real estate portal, and shows a color-coded heat map of asking prices by square foot throughout the Bay Area, including Sonoma County. In certain key markets asking prices per square foot are anywhere from ten to even twenty or thirty percent above last year’s figures.Why? Because there is almost NO inventory available for all the home-buyers out there. You can see on this map that Sonoma County communities such as Healdsburg and the Valley of the Moon corridor are at the higher end of these ranges. Newly pending sales are at a many year high now, and inventory in Sonoma County may be reaching an all time low. More about this in future posts.


